27 Mar 2022
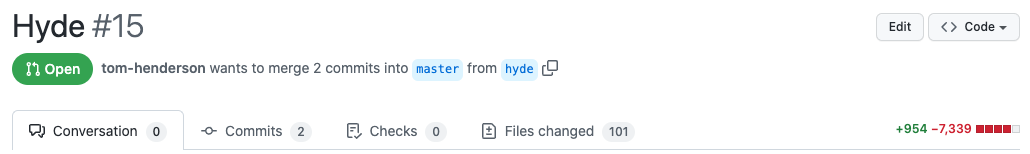
I’ve had this site running on GitHub pages for about 6 years now, and thought it was about time for a bit of a facelift. The previous design, based on the Mediator theme, was starting to feel a bit heavy and over-complicated.

The html was a big mess of divs with dozens of classes and whenever I wanted to make a change I found it just too much effort to figure out which classes needed changing or which include or template was involved. I’m also a bit over the trend of massive header images, even though I did enjoy picking out the images when I used them. I had also reached the point where I didn’t really want my site to look like Medium any more.

Another goal in the refresh was to drop as much of the bloat as possible. I’m still using Disqus for comments, which means I’m still loading a bunch of social sharing garbage on every page load, but at some point I’d like to swap that out for something more simple, possibly something running on lambda / dynamodb. For now Disqus will have to do, although I’m also considering just removing comments altogether.
Maybe one day I’ll build a theme from scratch, but for now the Hyde theme seems to have everything I need for a personal site. The only significant changes I made were an archive page with a list of all posts, a tweak to the top menu at mobile sizes, renamed related posts to recent (since that’s what they are in GitHub pages), and found a nice blue for the sidebar that I really like.
11 Jan 2022
I’ve long been an advocate for using filters to improve the signal to noise ratio of email. Ideally you want this stuff to happen on the mail server, so that the filtering happens automatically, regardless of where you actually read your mail. I like to keep most mail that isn’t directly for me out of my inbox, and then automatically mark as read things that are noisy or just notifications / informational.
Gmail lets you create some pretty complex filters, but the UI for managing these can get quite cumbersome once you have more than a handful of rules. Fortunately gmail-yaml-filters exists to simplify the process.
I started by exporting my current rules as a backup, and then worked through the list duplicating them in the yaml syntax. I was able to take the 28 rules exported from Gmail and represent them in just 6 top level rules. Running gmail-yaml-filters on this file creates (more-or-less) exactly the same set of rules.
By combining rule definitions using the more operator the rules are much simpler to parse. For example, I like to label mailing lists and move them out of the inbox. By using more I can then selectively mark as read or delete.
- list: <list.name>
  label: "Some List"
  archive: true
  not_important: true
  more:
    - subject: "Some annoying notification"
      read: true

    - from: something-noisy@example.com
      read: true
      delete: true
This generates an xml file with 3 filters:
- Everything from the mailing list is labeled with
Some List, and archived.
- If the subject matches
Some annoying notification it will be marked as read.
- If the sender is
something-noisy@example.com it will be deleted.
To build this inside Gmail I would need to remember to add all the conditions and actions for every rule - forgetting to add the list condition to the last rule would delete everything from that address, not just messages to that list.
It’s also easy to make fairly complex rules:
- from:
    all:
      - -work.com
      - -example.com
  more:
    - subject:
        any:
          - webcast
          - webinar
          - workshop
          - scrum
      label: Webinars
      archive: true

    - has:
        any:
          - webcast
          - webinar
          - workshop
          - scrum
      label: Webinars
      archive: true
By not having any actions in the top level element, this creates two rules, which both include the not filter at the top.
Once you have a working filter set it only takes a few minutes to export it as xml, and import into Gmail. Technically you could give it access to do this for you but I don’t really trust anything to log into my email.
27 Jun 2021
We can make sure Athena only reads as much data as it needs for a particular query by partitioning our data. We do this by storing the data files in a Hive folder structure that represents the patitions we’ll use in our queries.
s3://mybucket/data/year=2021/month=06/day=27/file1.json
s3://mybucket/data/year=2021/month=06/day=27/file2.json
s3://mybucket/data/year=2021/month=06/day=28/file1.json
We can then create a table partitioned by the keys used in the folder structure.
CREATE EXTERNAL TABLE example (
    foo string,
    bar string,
    baz string
)
PARTITIONED BY (year int, month int, day int)
ROW FORMAT SERDE 'org.openx.data.jsonserde.JsonSerDe'
LOCATION 's3://mybucket/data/'
We then need to tell Athena about the partitions. We can either do this with ALTER TABLE example ADD PARTITION (year='2021, month=06, day=27);, or by running MSCK REPAIR TABLE example;, which will crawl the folder structure and add any partitions it finds. Once the partitions are loaded we can query the data, restricting the query to just the required partitions:
SELECT * FROM example
WHERE year=2021 AND month=6 AND day=27
The problem with this is that we either need to know every about every partition before we can query the data, or repair the table to make sure our partitions are up to date - a process that will take longer and longer to run as our table grows.
There is a better way! By using partition projection we can tell Athena where to look for partitions. At query time, if the partition doesn’t exist, the query will just return no rows for that partition. Queries should also be faster when there are a lot of partitions, since Athena doesn’t need to query the metadata store to find them.
CREATE EXTERNAL TABLE example (
    foo string,
    bar string,
    baz string
)
PARTITIONED BY (year int, month int, day int)
ROW FORMAT SERDE 'org.openx.data.jsonserde.JsonSerDe'
LOCATION 's3://mybucket/data/'
TABLEPROPERTIES (
    'projection.enabled' = 'true',
    'projection.year.type' = 'integer',
    'projection.year.range' = '2020,2021',
    'projection.month.type' = 'integer',
    'projection.month.range' = '1-12',
    'projection.day.type' = 'integer',
    'projection.day.range' = '1-31',
    'storage.location.template' = 's3://mybucket/data/${year}/${month}/${day}/'
)
We can query this table immediately, without needing to run ADD PARTITION or REPAIR TABLE, since Athena now knows what partitions can exist. Since we need to provide Athena with the range of expected values for each key, the year partition range will eventually need to be updated to keep up with new data.
Another option is to project an actual date partition. This time we treat the date path in S3 (yyyy/MM/dd) as a single partition key, which Athena will read and convert to a date field. We call this partition date_created as date is a reserved keyword.
CREATE EXTERNAL TABLE example (
    foo string,
    bar string,
    baz string
)
PARTITIONED BY (date_created string)
ROW FORMAT SERDE 'org.openx.data.jsonserde.JsonSerDe'
LOCATION 's3://mybucket/data/'
TBLPROPERTIES (
    'projection.enabled' = 'true',
    'projection.date_created.type' = 'date',
    'projection.date_created.format' = 'yyyy/MM/dd',
    'projection.date_created.interval' = '1',
    'projection.date_created.interval.unit' = 'DAYS',
    'projection.date_created.range' = '2021/01/01,NOW',
    'storage.location.template' = 's3://mybucket/data/${date_created}/'
)
With a date partition we no longer need to update the partition ranges. Using NOW for the upper boundary allows new data to automatically become queryable at the appropriate UTC time. We can also now use the date() function in queries and Athena will still find the required partitions to limit the amount of data read.
SELECT * FROM example
WHERE date_created >= date('2021-06-27')
01 May 2021
AWS finally released ECS Anywhere last week, which allows you to use ECS to schedule tasks on on-premise hosts. The whole setup is very straightforward, and it’s quite reasonably priced at $0.01025 per hour for each managed ECS Anywhere on-premises instance - about $1.72 per week per host.
We need a couple of bits of supporting infrastructure first: an IAM role for our on-premise hosts, and an ECS cluster.
Once that’s done we need to create an authorisation for each managed instance we want to add with aws ssm create-activation --iam-role ECSAnywhereRole. This returns an ActivationId and ActivationCode, which will be used to register the instances with Systems Manager.
Finally we are ready to create the cluster. On each machine we just need to download the provided install script, and run it, passing in the region, cluster name and SSM activation codes.
curl --proto "https" -o "/tmp/ecs-anywhere-install.sh" "https://amazon-ecs-agent.s3.amazonaws.com/ecs-anywhere-install-latest.sh"
sudo bash /tmp/ecs-anywhere-install.sh --region $REGION --cluster $CLUSTER_NAME --activation-id $ACTIVATION_ID --activation-code $ACTIVATION_CODE
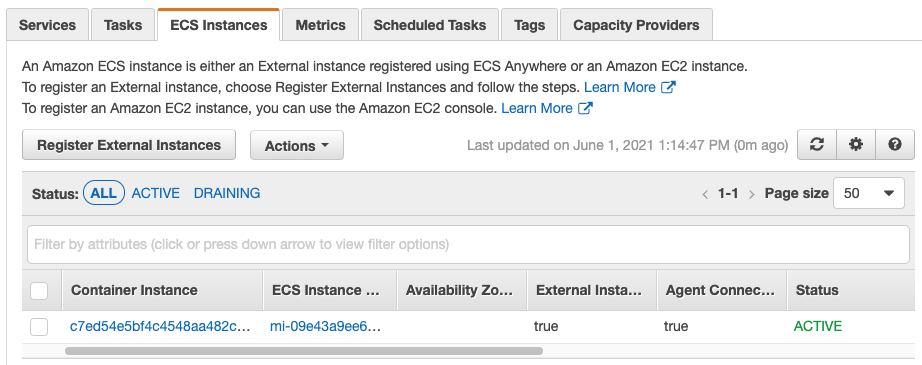
That’s really all there is to it. The instances should appear in the ECS cluster console with instance IDs beginning with mi-.
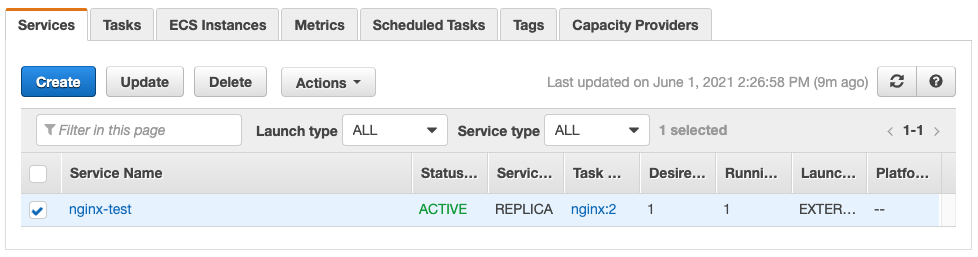
Now that our cluster is up and running we can create a task definition and deploy it to our servers. Here I’ve just used the example task definition from the docs.
20 Apr 2021
Even with session manager for accessing instances, sometimes it’s handy to just open up a port to your current IP address - to allow access to a load balancer for example. One quick way to do this is with an external data source.
As long as the program returns JSON, we can access it’s properties, for example in a security group rule: cidr_blocks = "${data.external.current_ip.result.ip}/32".
Don’t use this for anything other than testing though, since it’ll change if anyone else runs an apply!