Observium CE Slack Integration
07 Jan 2020The last CE release of Observium (19.8.10000) removed several alert transports that are now only available in their paid edition.
Since the external program transport still exists we can create a reasonable replacement for this with a simple shell script and the environment variables that Observium makes available when calling it.
This script can be installed on a server to easily send messages to slack. The only requirement is for the SLACK_WEBHOOK_URL environment variable to be set with the URL of the Slack webhook integration to use. How you set this will depend on your environment - in my lab I just put it in /etc/environment, however keep in mind that this allows all users of the system to use the webhook.
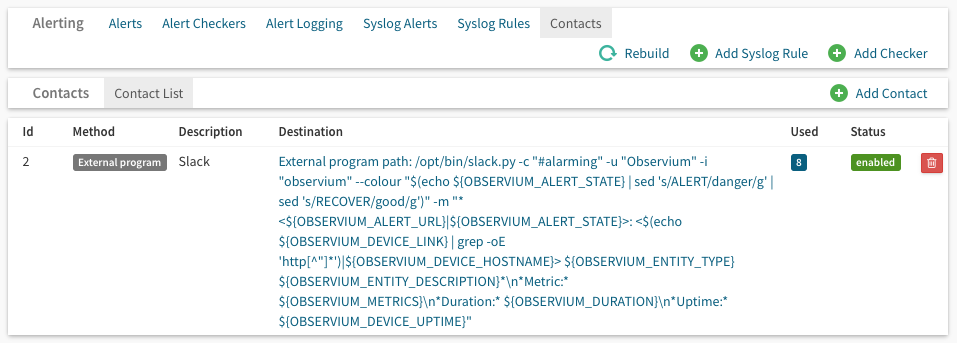
To use the script in Observium, create a new contact using the external program transport, and set the path to the following (making sure you have the path to slack.py correct at the start).
/opt/bin/slack.py -c "#alarming" -u "Observium" -i "observium" --colour "$(echo ${OBSERVIUM_ALERT_STATE} | sed 's/ALERT/danger/g' | sed 's/RECOVER/good/g')" -m "*<${OBSERVIUM_ALERT_URL}|${OBSERVIUM_ALERT_STATE}>: <$(echo ${OBSERVIUM_DEVICE_LINK} | grep -oE 'http[^"]*')|${OBSERVIUM_DEVICE_HOSTNAME}> ${OBSERVIUM_ENTITY_TYPE} ${OBSERVIUM_ENTITY_DESCRIPTION}*\n*Metric:* ${OBSERVIUM_METRICS}\n*Duration:* ${OBSERVIUM_DURATION}\n*Uptime:* ${OBSERVIUM_DEVICE_UPTIME}"
Breaking that down, since it’s a bit hard to read, first we have the script being called with the channel, username and icon /opt/bin/slack.py -c "#alarming" -u "Observium" -i "observium".
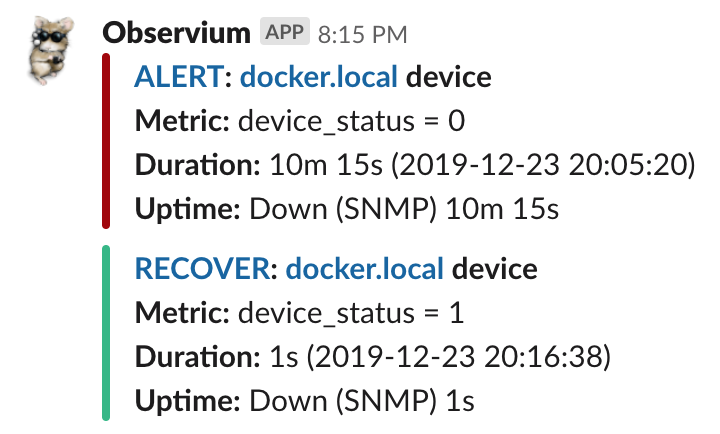
Next we set the --color parameter based on the value of $OBSERVIUM_ALERT_STATE. This adds a green or red bar to the side of the message block.
"$(echo ${OBSERVIUM_ALERT_STATE} | sed 's/ALERT/danger/g' | sed 's/RECOVER/good/g')"
Finally the actual message payload (broken down with new lines added):
"*<${OBSERVIUM_ALERT_URL}|${OBSERVIUM_ALERT_STATE}>: <$(echo ${OBSERVIUM_DEVICE_LINK} | grep -oE 'http[^"]*')|${OBSERVIUM_DEVICE_HOSTNAME}> ${OBSERVIUM_ENTITY_TYPE} ${OBSERVIUM_ENTITY_DESCRIPTION}*\n
*Metric:* ${OBSERVIUM_METRICS}\n
*Duration:* ${OBSERVIUM_DURATION}\n
*Uptime:* ${OBSERVIUM_DEVICE_UPTIME}"
This should result in alerts that look a bit like this:
If you want to customise the message you can use any of these variables which should be available in the script’s execution environment (found in includes/alerts.inc.php):
ALERT_ID
ALERT_MESSAGE
ALERT_STATE
ALERT_TIMESTAMP
ALERT_URL
CONDITIONS
DEVICE_HARDWARE
DEVICE_HOSTNAME
DEVICE_ID
DEVICE_LINK
DEVICE_LOCATION
DEVICE_OS
DEVICE_UPTIME
DURATION
ENTITY_DESCRIPTION
ENTITY_GRAPHS_ARRAY
ENTITY_ID
ENTITY_LINK
ENTITY_NAME
ENTITY_TYPE
METRICS
TITLE