Adding Yoctopuce Sensors to Observium
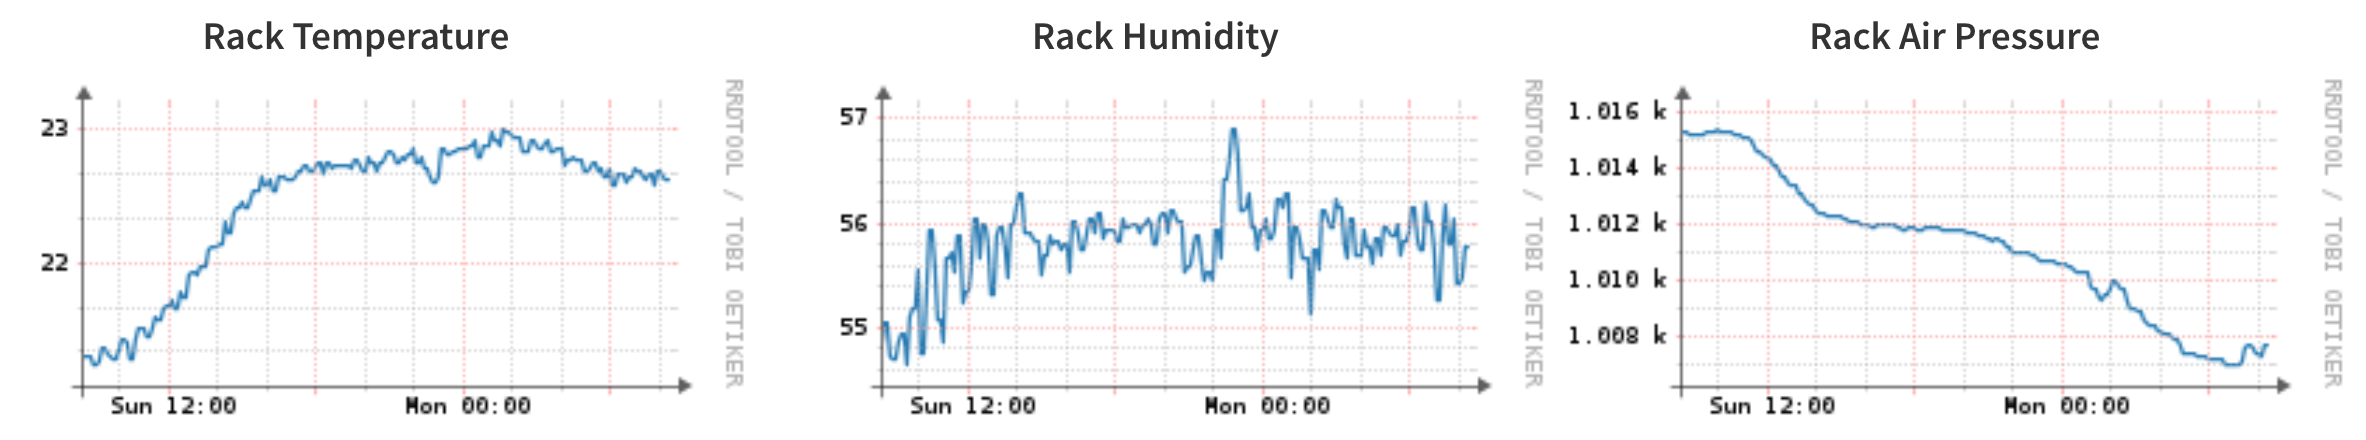
19 Jun 2018 ⚠️ This post is over 7 years old. It may no longer be up to date.I came across the Yoctopuce USB sensors recently and thought it might be fun to use one to monitor the closet I keep my network rack & servers in. I picked up one of the Yocto-Meto sensors, which combines humidity, pressure, and temperature sensors, and hooked it up to the server with a USB cable.
Observium primarily deals with SNMP, but also includes a Unix Agent which allows it to collect other system and application metrics. The agent essentially executes a folder full of shell scripts, each of which is responsible for writing some application or service metrics to stdout.
I wrote a short python script to poll the sensor and output the current values using the unix agent format, and saved it to /usr/local/lib/observium-agent/yoctopuce:
The agent is normally configured to execute using xinetd. On macOS we can use launchctl to listen on a port and execute our script by adding the following to ~/Library/LaunchAgents/org.observium.agent.plist and enabling it with launchctl load ~/Library/LaunchAgents/org.observium.agent.plist.
After loading the agent it can be tested by running telnet 127.0.0.1 36602, which will spit out the output of the script above and then disconnect.
<<<yoctopuce>>>
temperature:rack:20
humidity:rack:55
pressure:rack:1.016
It took me a bit of digging around to work out what I needed to change to get this data into Observium. I’m running the CE edition, which is a bit out of date now so things could have changed since this release. Since temperature, pressure and humidity are already built in sensor types, this seems to be all that’s needed to get the sensors discovered. I saved it into /opt/observium/includes/polling/unix-agent/yoctopuce.inc.php.
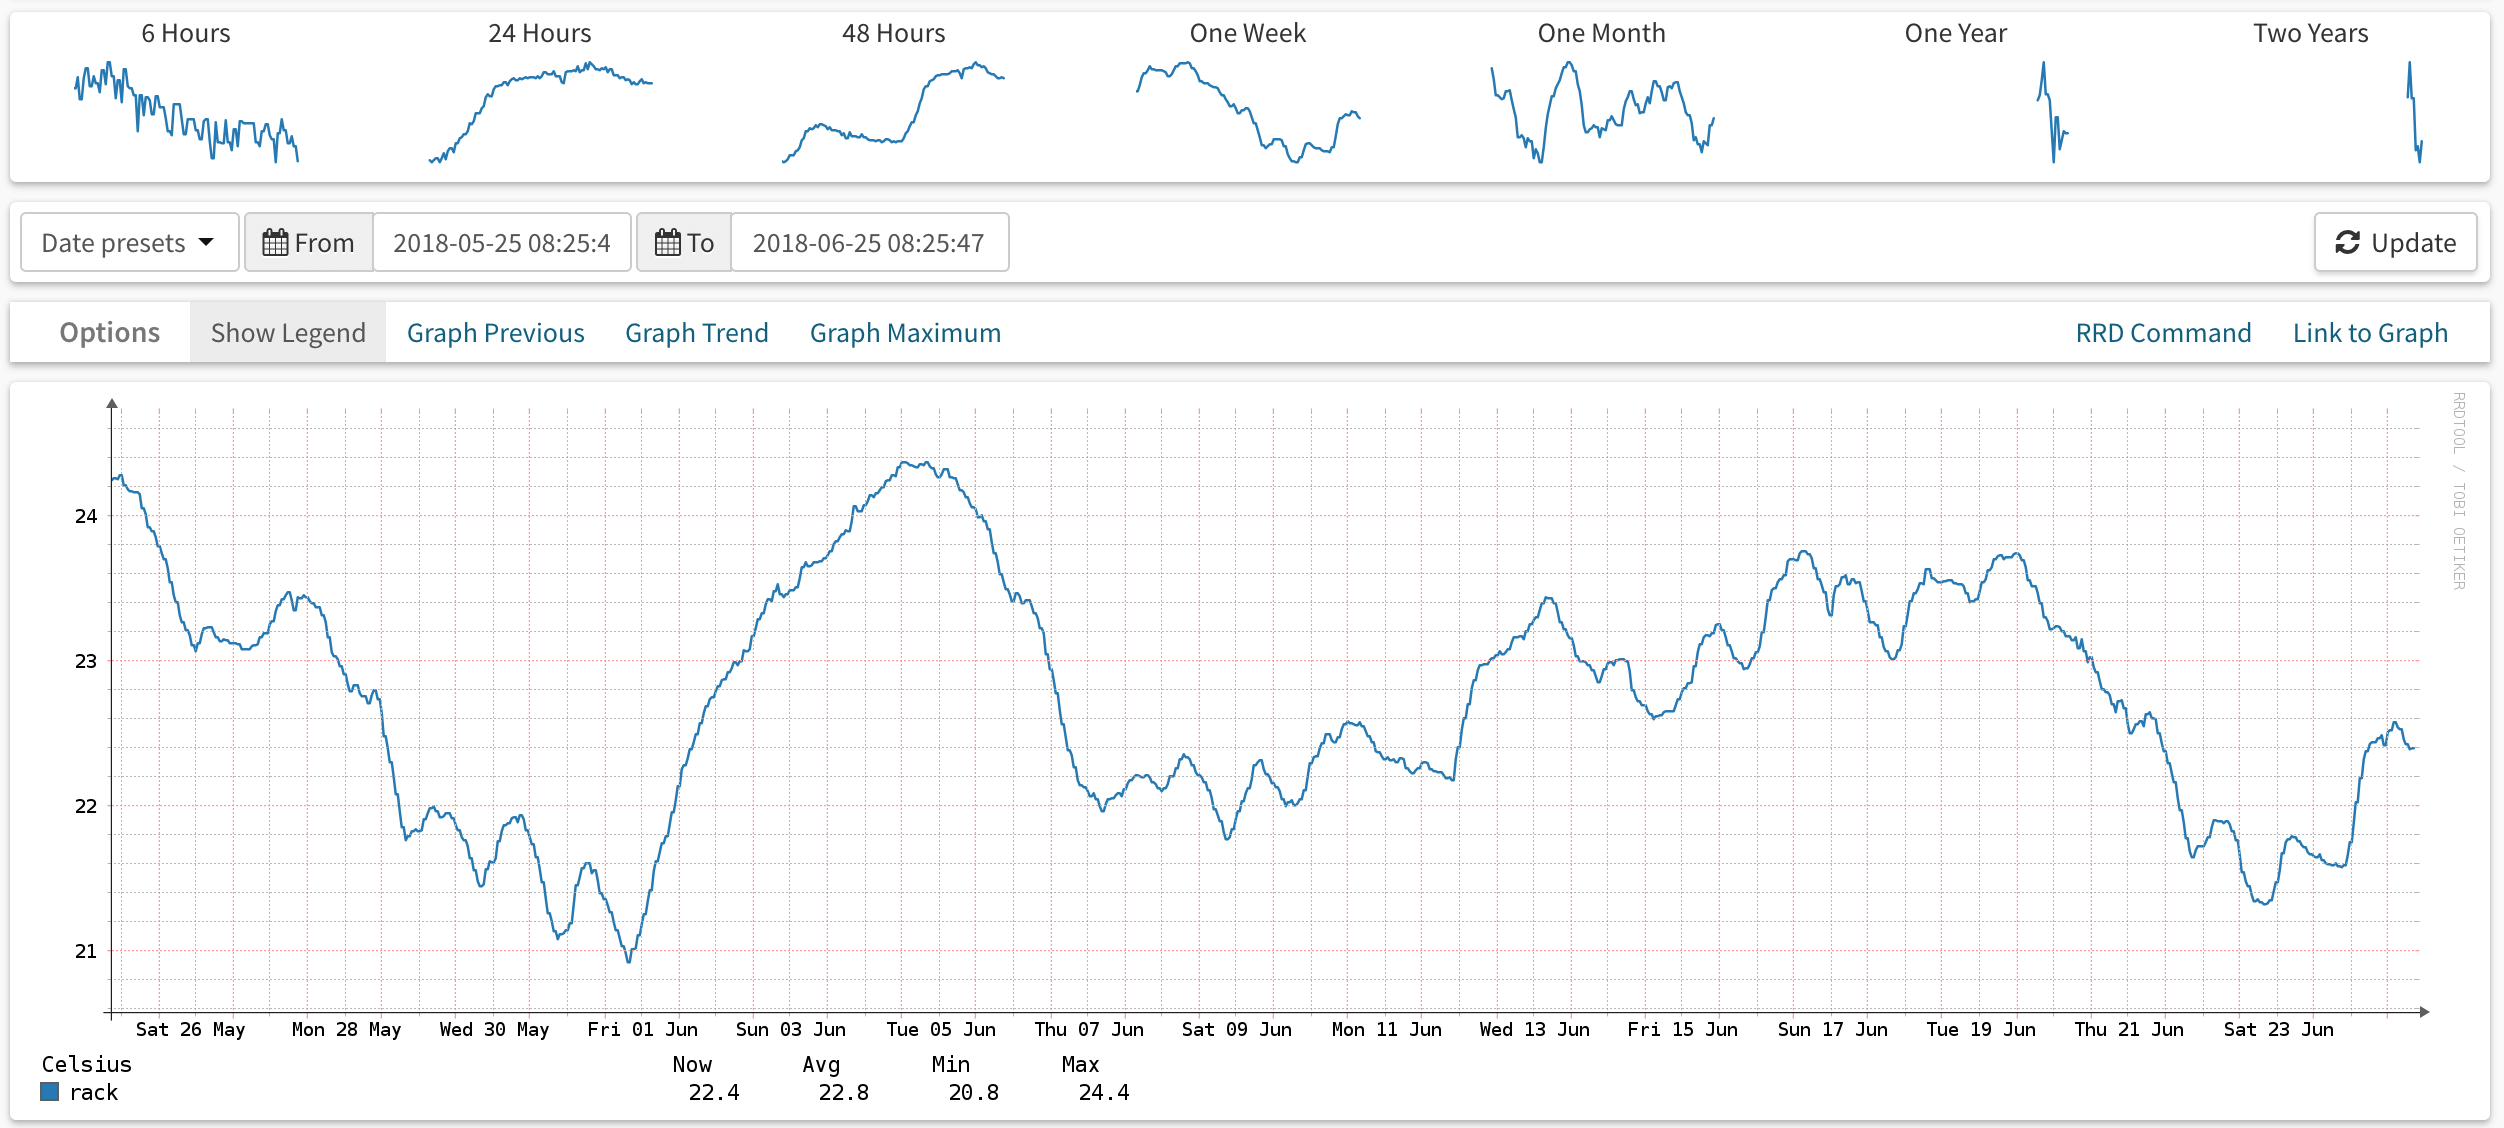
After enabling unix agent polling for the server, Observium picks it up based on the <<<yoctopuce>>> header in the output and creates an RRD for each sensor.