Monitoring APT Updates with Grafana & Prometheus
04 Dec 2020Pending Update Metrics
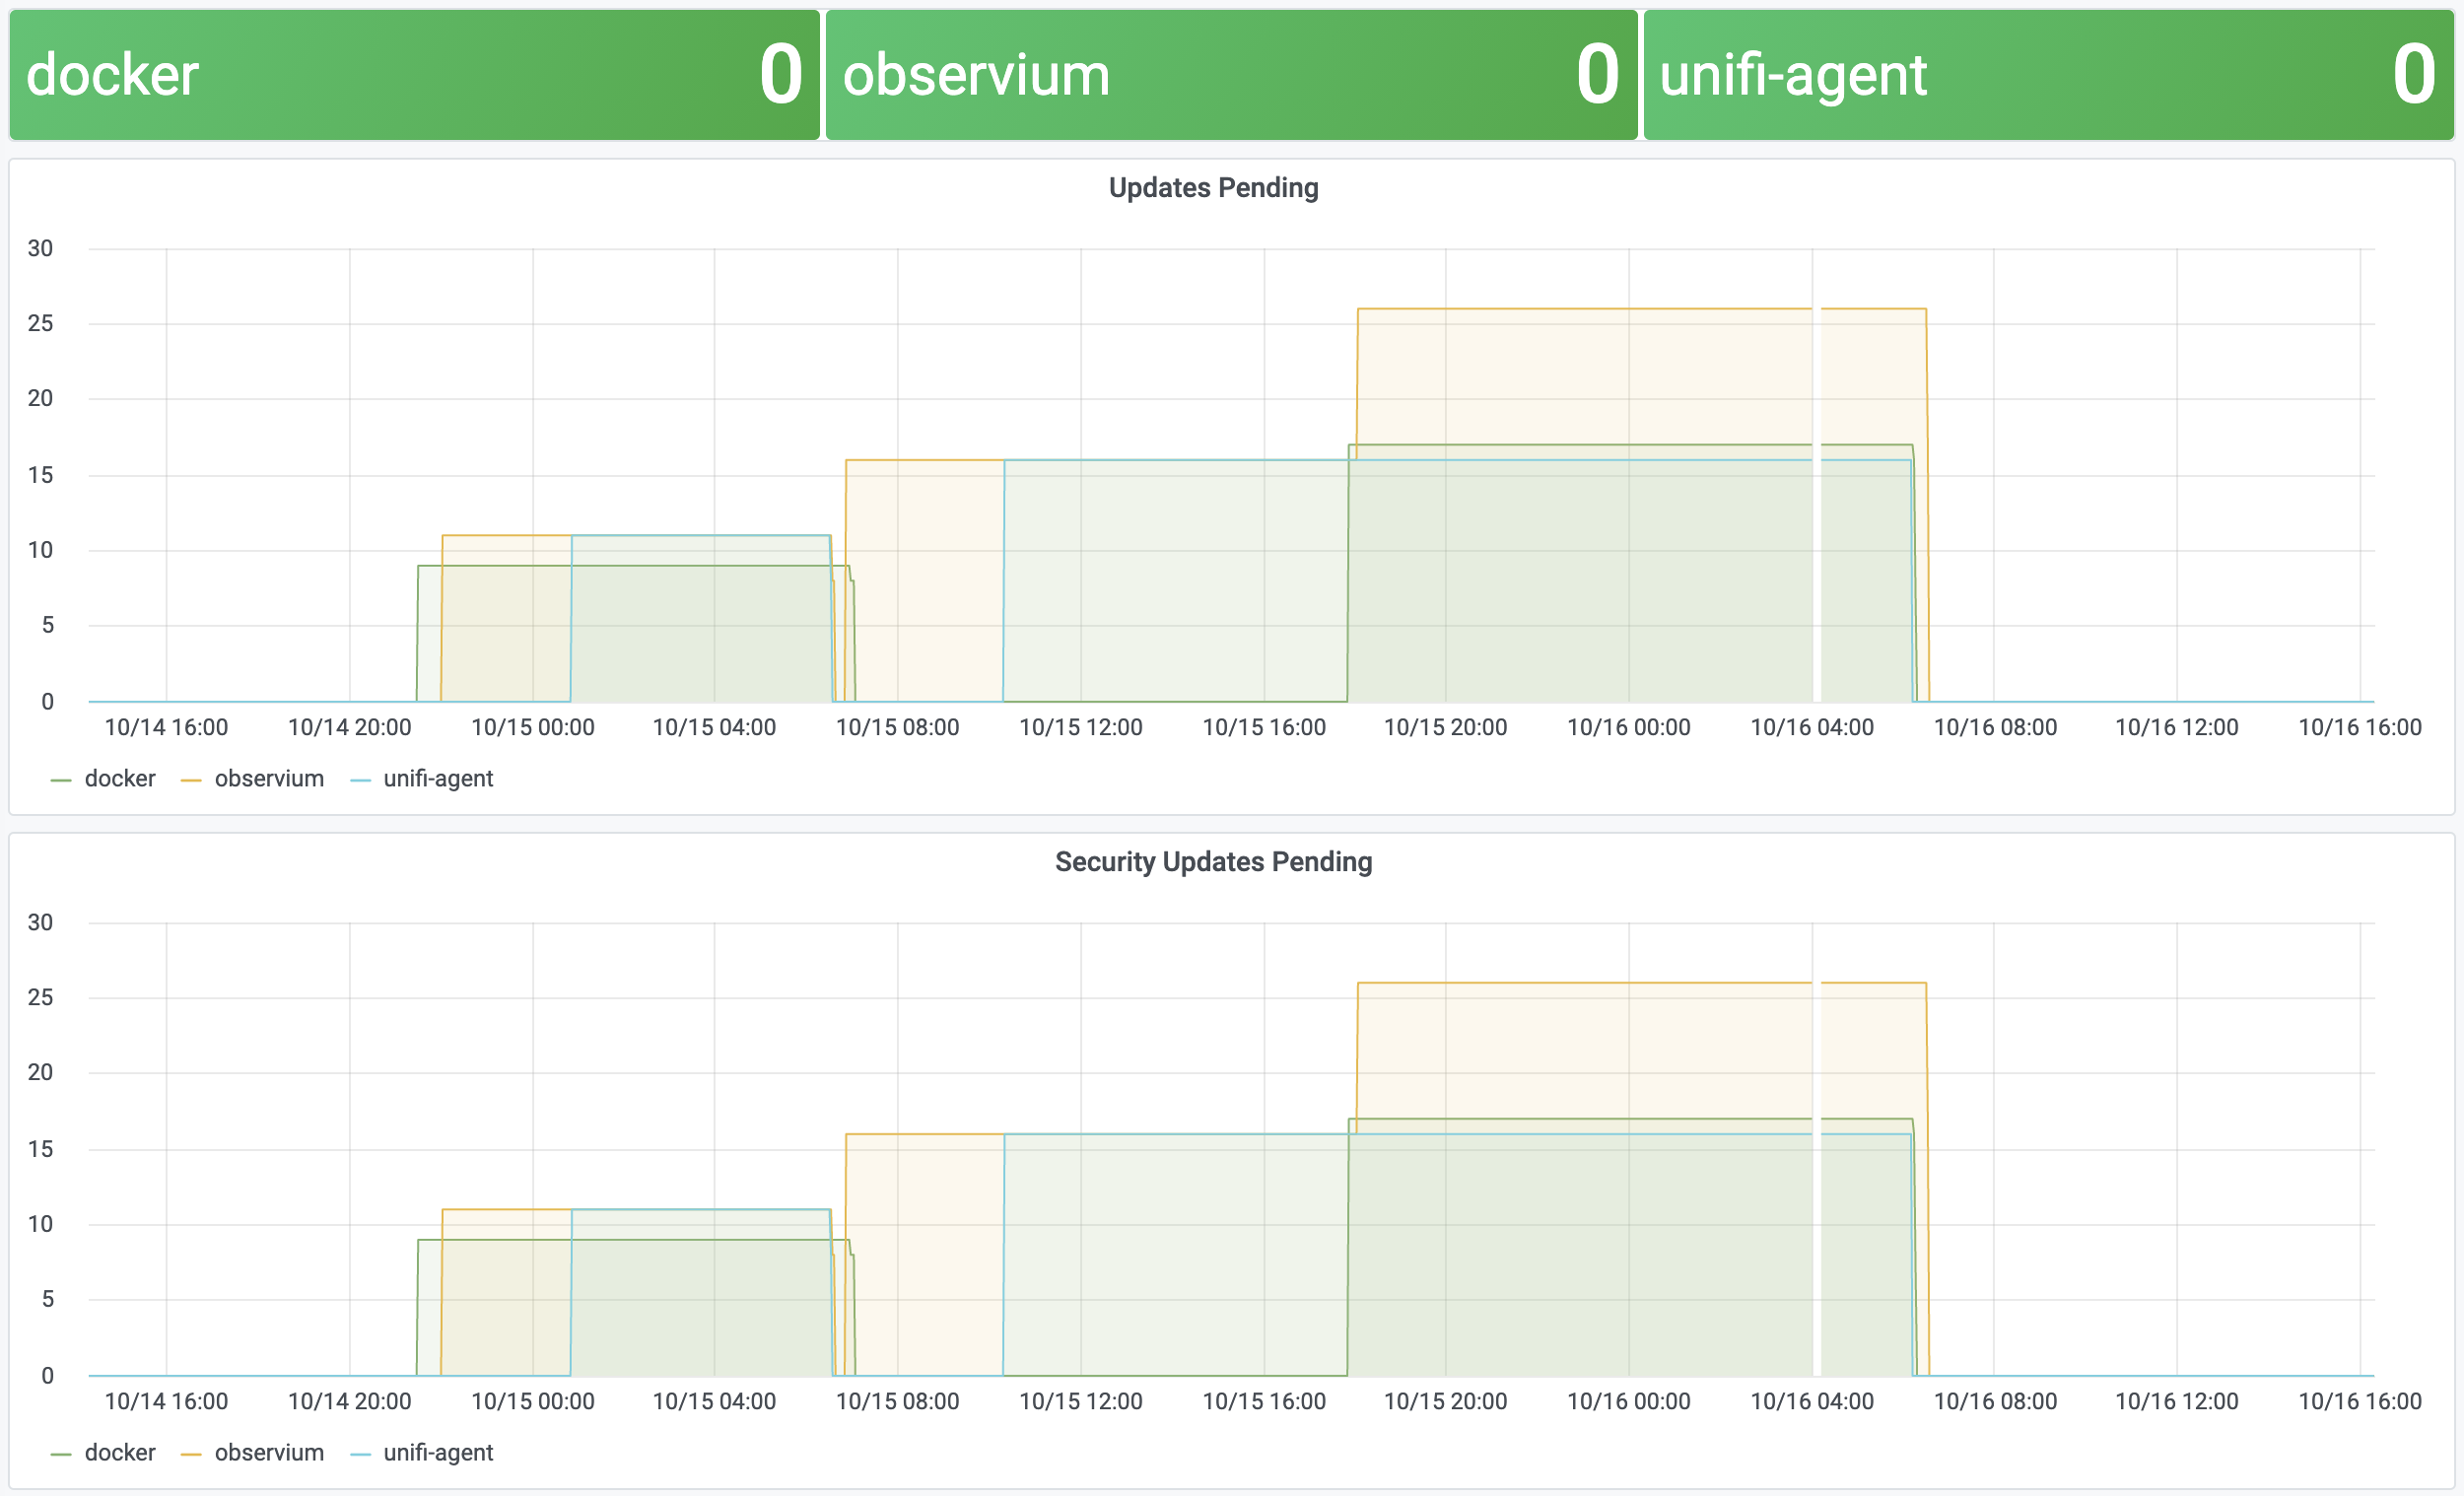
APT conveniently has some hooks available to run custom scripts before, during and after patching. We can take advantage of these to publish a metrics file that can be picked up by node_exporter to monitor the status of pending updates across our servers.
First we need a script to get the number of updates available, and if a reboot is required. We are leaning on the script in the update-notifier-common package, which outputs the number of updates, and security updates pending.
#!/bin/bash -e
# /usr/share/apt-metrics

APT_CHECK=$([ -f /var/run/reboot-required ] && /usr/lib/update-notifier/apt-check || echo "0;0")

UPDATES=$(echo "$APT_CHECK" | cut -d ';' -f 1)
SECURITY=$(echo "$APT_CHECK" | cut -d ';' -f 2)
REBOOT=$([ -f /var/run/reboot-required ] && echo 1 || echo 0)

echo "# HELP apt_upgrades_pending Apt package pending updates by origin."
echo "# TYPE apt_upgrades_pending gauge"
echo "apt_upgrades_pending ${UPDATES}"

echo "# HELP apt_security_upgrades_pending Apt package pending security updates by origin."
echo "# TYPE apt_security_upgrades_pending gauge"
echo "apt_security_upgrades_pending ${SECURITY}"

echo "# HELP node_reboot_required Node reboot is required for software updates."
echo "# TYPE node_reboot_required gauge"
echo "node_reboot_required ${REBOOT}"
We set up the APT::Update::Post-Invoke-Success and DPkg::Post-Invoke triggers to call this script, which will update our metric after each apt update run, and after each package installation step.
# /etc/apt/apt.conf.d/60prometheus-metrics
APT::Update::Post-Invoke-Success {
  "/usr/share/apt-metrics | sponge /var/lib/node_exporter/textfile_collector/apt.prom || true"
};

DPkg::Post-Invoke {
  "/usr/share/apt-metrics | sponge /var/lib/node_exporter/textfile_collector/apt.prom || true"
};
As long as APT::Periodic::Update-Package-Lists is set in /etc/apt/apt.conf.d/10periodic, pending updates will now be exported as metrics via node_exporter. If unnattended-upgrades is installed and configured the metrics will also go back down as updates are installed automatically.
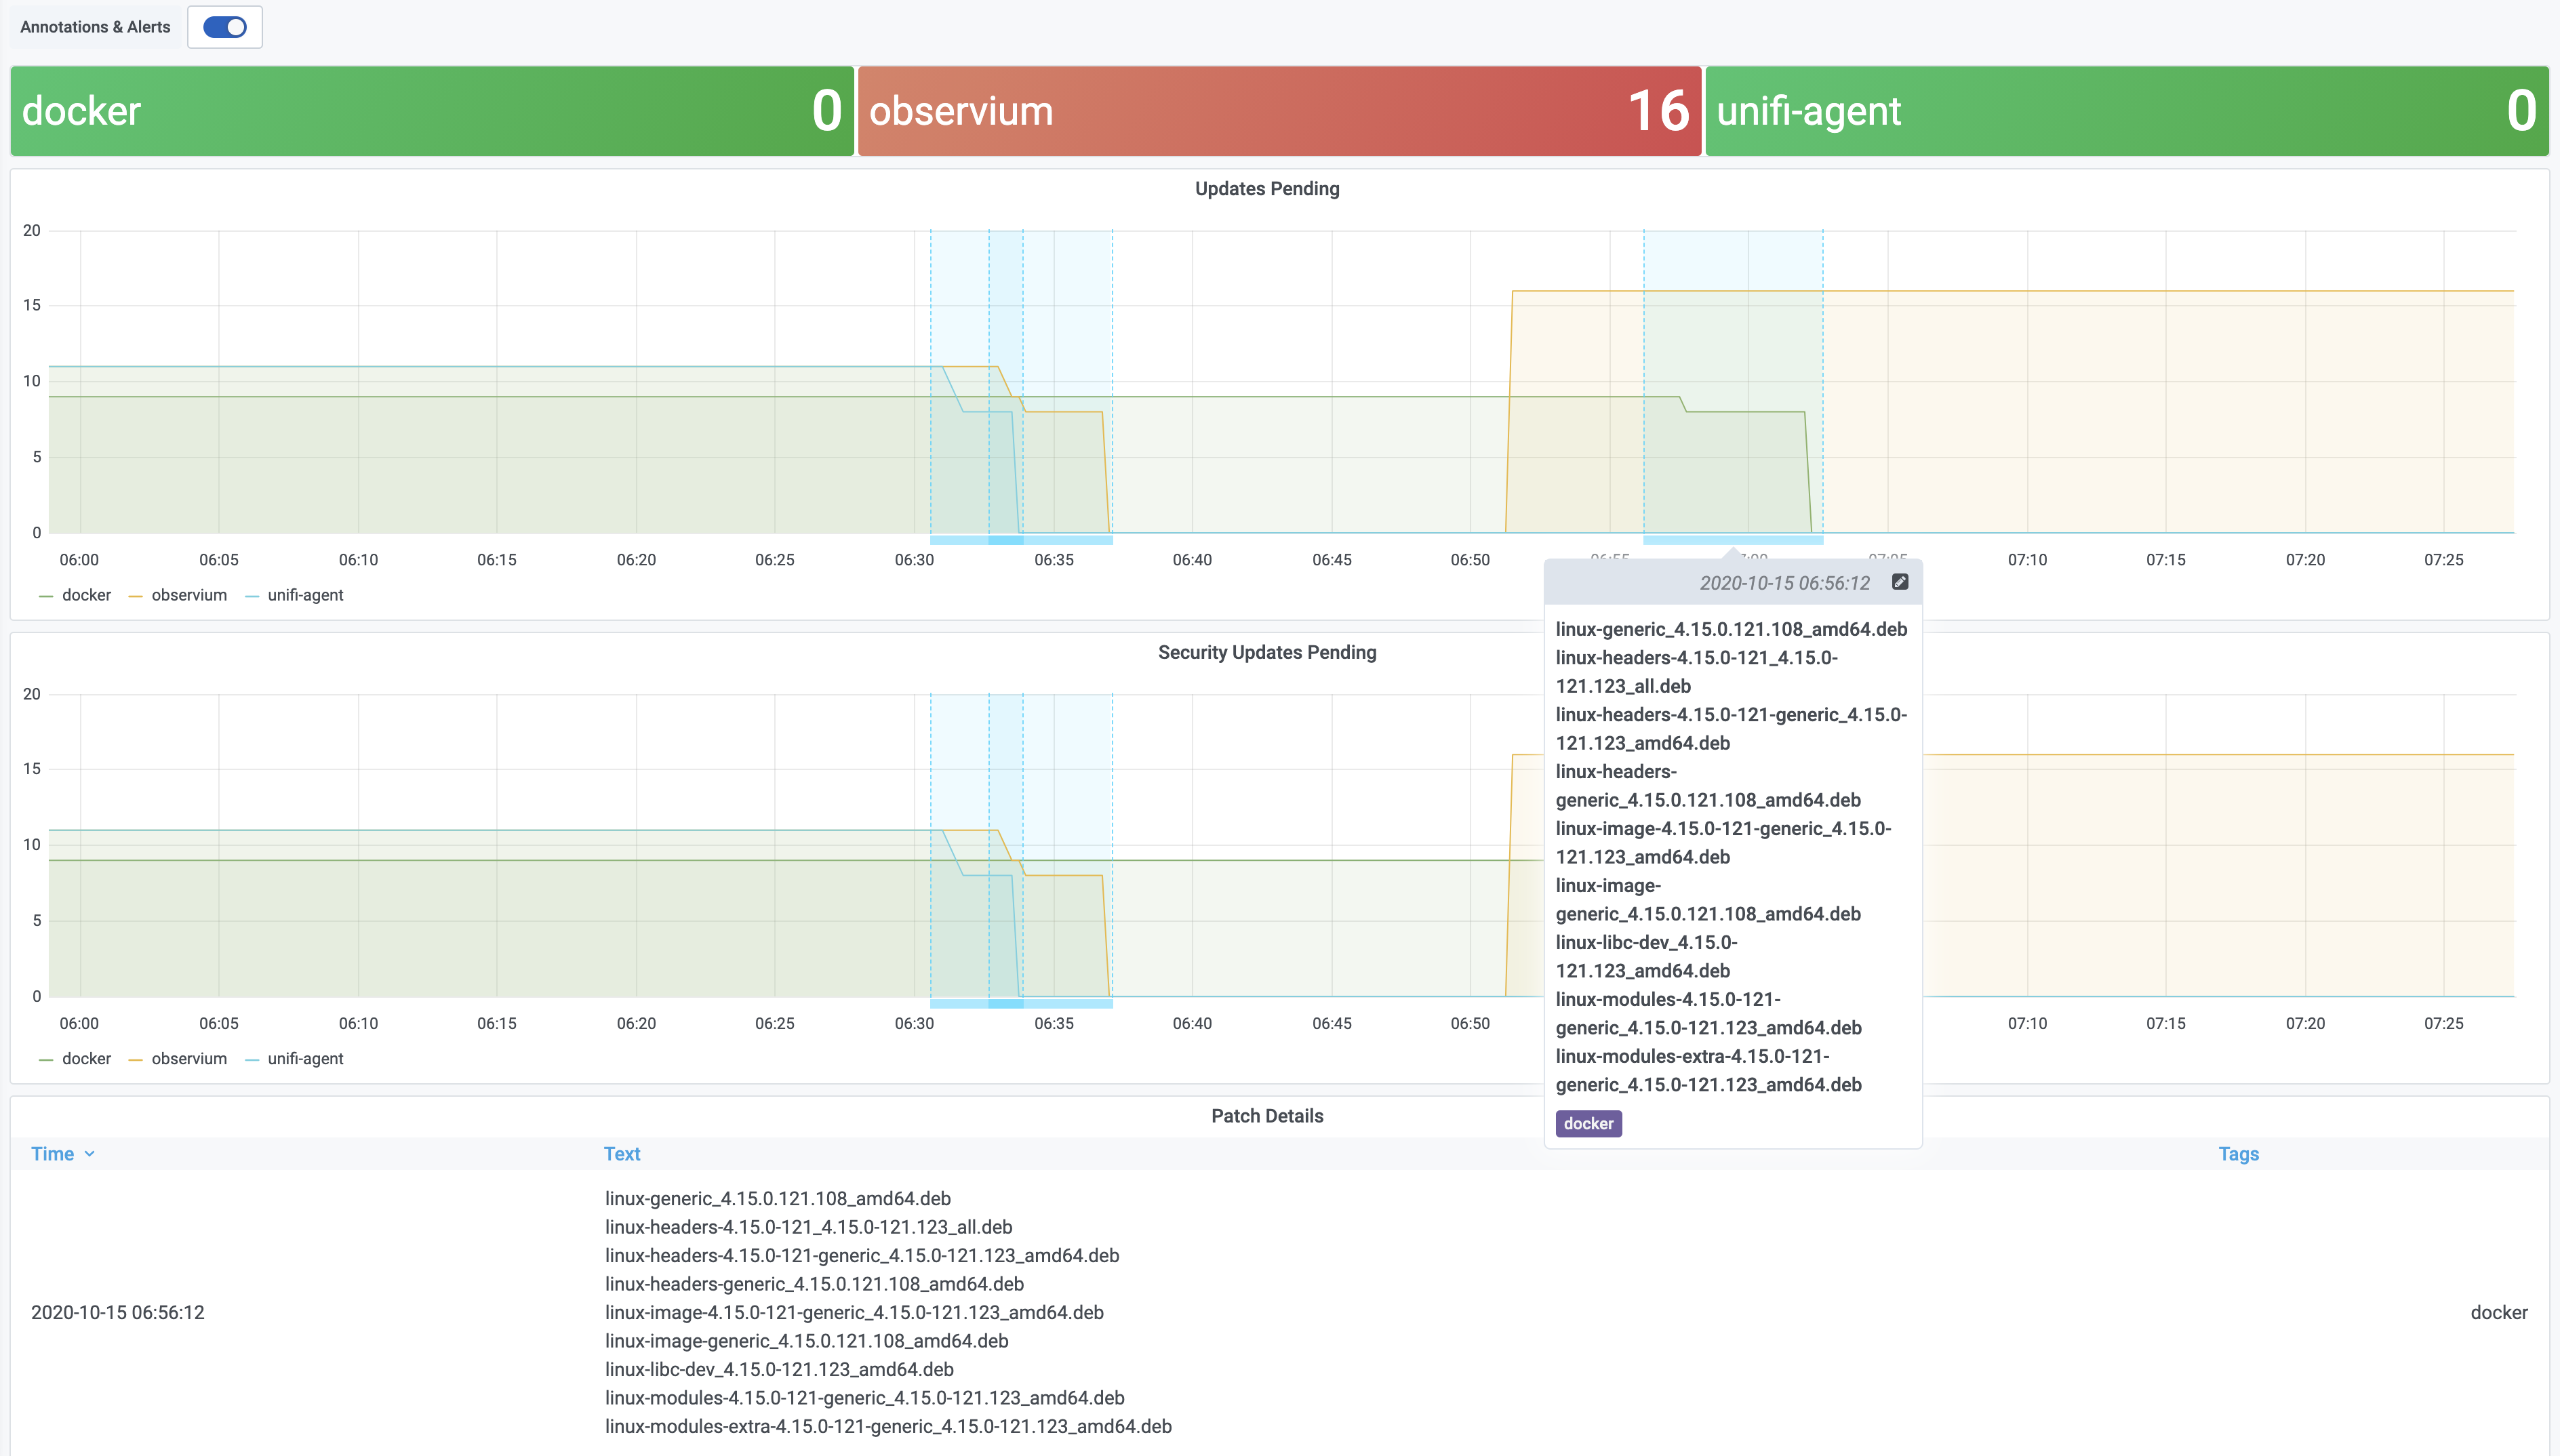
Automatic Update Annotations
We can take it a step further and add Grafana annotations for automatic updates activity, to show what updates are being installed. These annotations are stored in Grafana, against a specific dashboard. In these examples my dasbboard ID is 3. I’ve also added a Grafana API key in /etc/environment to allow us to push annotations.
We need to add an environment file for apt-daily-upgrade.service to pass in some additional options to the apt-daily-upgrade service. This will run our /usr/share/annotate script when the update job starts and stops.
# /etc/systemd/system/apt-daily-upgrade.service.d/environment
[Service]
EnvironmentFile=-/etc/environment
ExecStartPre=-/usr/share/annotate -d 3
ExecStartPost=-/usr/share/annotate
We also add another apt hook to record the details of each package before it is installed. This will be pushed as the body of the annotation once the apt run is complete.
# /etc/apt/apt.conf.d/60annotations
DPkg::Pre-Install-Pkgs {
	"/usr/share/annotate -p - || true";
};
The annotate script does most of the work. When updates start it creates an annotation in Grafana, and keeps a record if it under /var/run. When patching is complete the script updates the annotation to add an end time, and updates the body of the annotation with the details of the installed patches. The script calls grafana-annotation.py to create the annotations, which is a simple wrapper around the annotation API calls.
#!/bin/bash -e
# /usr/share/anotate

while getopts ":d:p:" opt; do
    case $opt in
        d)
            DASHBOARD="$OPTARG"
            ;;
        p)
            PATCH="$OPTARG"
            ;;
        \?)
            echo "Invalid option -$OPTARG" >&2
            exit 1
            ;;
        :)
            echo "Option -$OPTARG requires an argument." >&2
            exit 1
            ;;
    esac
done

ANNOTATE=/usr/share/grafana-annotation.py
ANNOTATION_TMP=/var/run/unattended-upgrades-annotation.json
ANNOTATION_LOG=/var/run/unattended-upgrades-annotation-log

urldecode() { : "${*//+/ }"; echo -e "${_//%/\\x}"; }

if [[ -n "${DASHBOARD}" ]]; then
    echo "Annotating dashboard ${DASHBOARD}"
    # Create the start annotation
    ${ANNOTATE} --dashboard "${DASHBOARD}" --message "Unattended upgrades started." --output "${ANNOTATION_TMP}"
    exit 0
fi

if [[ -f ${ANNOTATION_TMP} ]]; then
    if [[ -n "${PATCH}" ]]; then
        echo "Input: ${PATCH}"
        if [[ "${PATCH}" = '-' ]]; then
            # Read from stdin
            PATCH=$(cat)
        fi
        echo "Recording applied patches"
        # Add to log and stop since we're not done.
        echo "${PATCH}" >> ${ANNOTATION_LOG}
        exit 0
    fi

    ANNOTATION_ID=$(jq --raw-output .id "${ANNOTATION_TMP}")
    if [[ -f ${ANNOTATION_LOG} ]]; then
        # Update the annotation
        echo "Completing annotation ${ANNOTATION_ID}"
        # Add an end time to the annotation
        COMMON_PREFIX="/var/cache/apt/archives/"
        PREFIX_LENGTH=$((${#COMMON_PREFIX} + 1))
        MESSAGE=$(cat ${ANNOTATION_LOG} | sort | uniq | cut -c ${PREFIX_LENGTH}-)
        ${ANNOTATE} --annotation "${ANNOTATION_ID}" --end "$(date +%s)" --message "${MESSAGE}"
    else
        echo "Deleting annotation ${ANNOTATION_ID}"
        ${ANNOTATE} --delete "${ANNOTATION_ID}"
    fi

    rm -f ${ANNOTATION_TMP} || true
    rm -f ${ANNOTATION_LOG} || true
    exit 0
fi